Gaussian Splat Dust Map
What happens if you try to fit the 3D distribution of dust in the Milky Way with Gaussian splats?
Specifically, we take the extinction data behind the Edenhofer et al. 2023 dust map
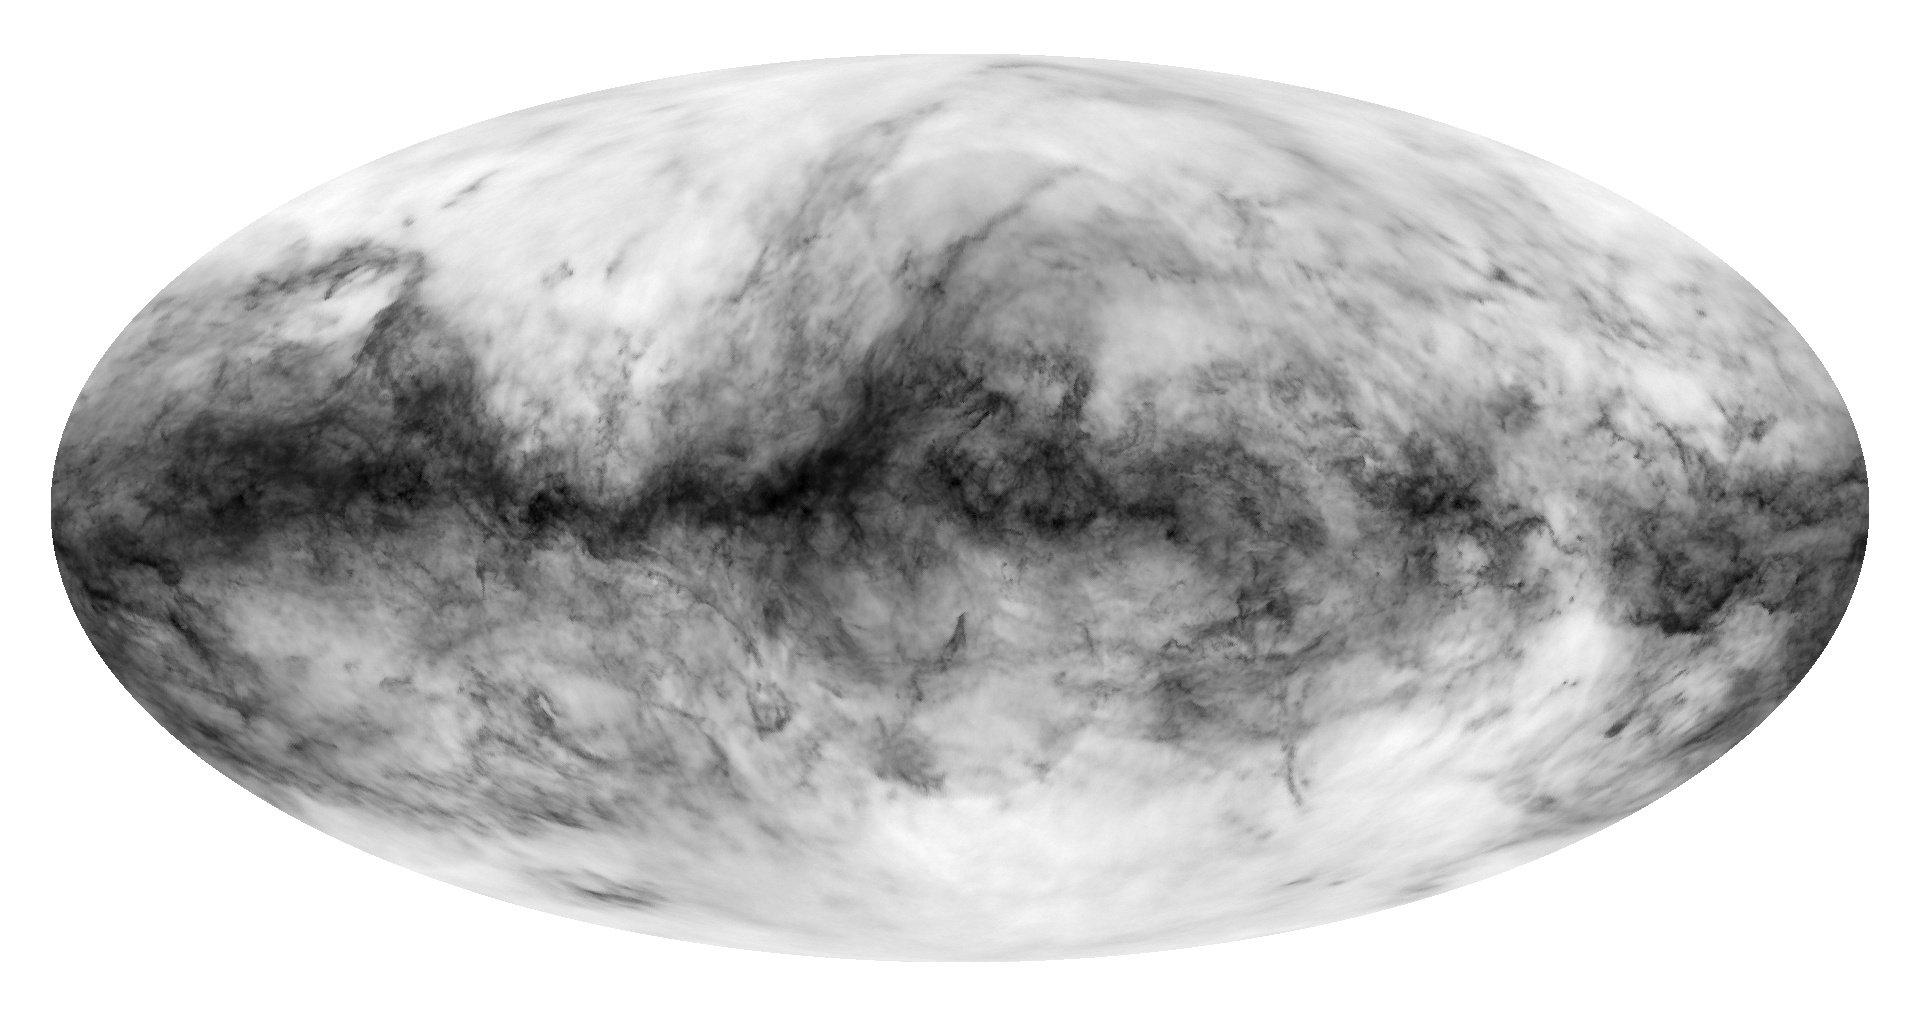
Something correct seems to be happening, but the splats look a lot worse. Uncertainty quantification is important for more reasons than one! We should note the splats took only a few minutes to fit and can be rendered live much faster than voxels, so this is an interesting direction to pursue for visualization of 3D maps of the ISM.
For fun, here’s an idea of the bounding meshes used to render these Gaussians extremely quickly.